


Optimizing Node.js for production is a different challenge from tuning it in development. As request volume grows, the event loop - Node's primary concurrency mechanism - becomes the first bottleneck. A single synchronous operation that takes 50ms can stall hundreds of queued requests, causing cascading slowdowns across your entire application.
Why Node.js Performance Optimization Matters for High-Traffic Applications
How Node.js Handles High-Concurrency Workloads in Modern Backend Systems
Performance optimization in Node.js is not a one-time task - it's an ongoing discipline with a direct impact on user experience, infrastructure cost, and system reliability. To understand why this matters, it helps to look at how Node.js handles load at the runtime level.
CPU-bound work: JSON serialization of big objects, complicated regular expressions, synchronous read on files - preempts all other requests in the queue. Businesses such as PayPal reported significant response time improvements since moving to Node.js. Uber operates millions of trips each day on Node.js. Neither result happened by accident - both required intentional, ongoing optimization.
Latest Node.js Performance Improvements and Their Impact on Production Systems
.webp)
Node.js version 20 comes with a faster V8 engine, a better ESM loader, and a garbage collector. Switching from CommonJS require() to ES modules can improve cold-start time when module resolution is correctly configured. According to the Node.js 2024 User Survey, over 60% of production deployments now run Node.js 18 or higher, unlocking these runtime gains.
Understanding Node.js Runtime Behavior for Performance Optimization
Node.js Architecture Explained: Event Loop, Non-Blocking I/O, and Scalability
The event loop is executed in the following phases: timers, I/O callbacks, idle/prepare, poll, check, and close callbacks. Knowledge of what stage your code is executing is important in debugging latency spikes. Work queued in the poll phase (waiting on I/O) is expected and generally fine. The problem is synchronous work inside callbacks that blocks the loop from advancing to the next phase.
Node.js vs Traditional Backend Runtimes: Performance Trade-offs at Scale
For web APIs with high I/O and modest CPU work, Node.js competes well. For heavy computation, pair it with WebAssembly modules or Rust-compiled WASM sidecars.
Core Node.js Performance Optimization Techniques That Actually Work
Writing Efficient Asynchronous Code to Avoid Event Loop Blocking
The most common mistake in Node.js backend code is using await inside loops. This runs async calls sequentially instead of in parallel.
js
// BAD - sequential, N database round-trips
for (const userId of userIds) {
  const user = await db.getUser(userId); // blocks next iteration
  results.push(user);
}

// GOOD - parallel, 1 round-trip batch
const users = await Promise.all(userIds.map(id => db.getUser(id)));
Please Note: Use Promise. all when requests are fully independent. If results depend on each other, or the array is large enough that flooding the database is a concern, use sequential execution or explicit batching instead.
AsyncLocalStorage lets you propagate request context - trace IDs, auth tokens - across async boundaries without threading values through every function. It adds less overhead than manually passing context objects.
Memory and CPU Management Strategies for High-Throughput Node.js Applications
The V8 garbage collector is automatic; however, you could assist it. Large objects that outlive their usefulness get promoted to the old-generation heap, increasing GC pause time.
- The effective production strategies are:
- Maintain request-level variables in local but not global variables.
- Use Buffer.alloc() when writing directly to a buffer - avoid allocating unless you're about to write immediately.
.webp)
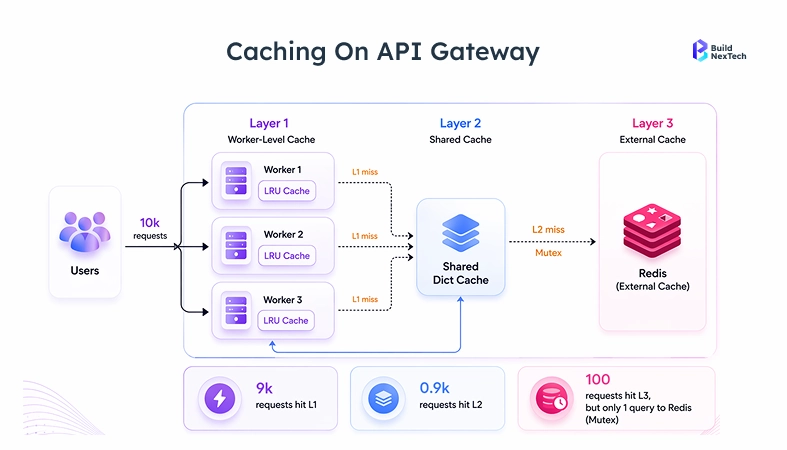
Caching Strategies to Reduce Latency and Improve System Throughput
Using Redis and In-Memory Caching to Handle High Request Volumes
The greatest leverage optimization you can ship is caching. A database query that lasts 40ms responds in 0.3ms with Redis, altering the profile of all subsequent performance.
js
async function getUserProfile(userId) {
  const cacheKey = `user:${userId}`;
  const cached = await redis.get(cacheKey);
  if (cached) return JSON.parse(cached);

  const user = await db.query('SELECT * FROM users WHERE id = ?', [userId]);
  await redis.set(cacheKey, JSON.stringify(user), 'EX', 300); // TTL: 5 min
  return user;
}
TTL-based expiry with a 30–300 second window covers most Node.js API use cases. Event-driven invalidation via message queues (RabbitMQ or Redis pub/sub) makes sense when data freshness is a hard business requirement, not just a nice-to-have.
Cache Invalidation Strategies to Prevent Data Inconsistency
Real-World Impact of Caching on API Response Time and Server Load
The performance information published by Cloudflare in 2023 indicated that the API routes with cache hits of over 70 percent decreased the load on the origin server by over 60 percent. In the case of the Node.js application that is behind Cloudflare or AWS CloudFront, proper setup of the cache-control header of the static files and semi-static API responses loads most of the read traffic before reaching the application layer.
Scaling Node.js Applications with Architecture Decisions That Drive Performance
Microservices vs Monolithic Architecture: Performance and Scalability Trade-offs
Start with a monolith, which is already modular. Only extract individual services when there are scalable needs of a certain component - image processing with high traffic is a good fit; the user settings endpoint is not.
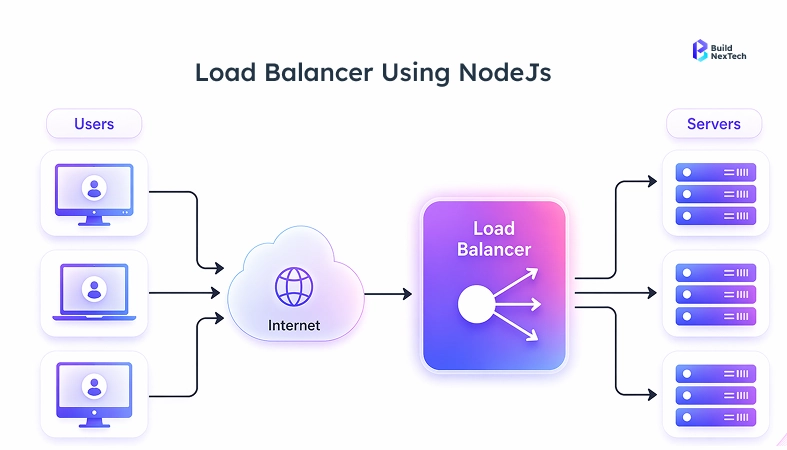
Load Balancing and Node.js Clustering for High-Traffic Systems
The Node.js code comes with the cluster module that forks the worker processes into the CPU cores. Every worker is using the identical port and operates in its own process using its own V8 heap and event loop.
js
import cluster from 'cluster';
import os from 'os';
import { createServer } from './server.js';

if (cluster.isPrimary) {
  const cpuCount = os.cpus().length;
  for (let i = 0; i < cpuCount; i++) {
    cluster.fork();
  }
  cluster.on('exit', (worker) => {
    console.log(`Worker ${worker.process.pid} died. Restarting...`);
    cluster.fork();
  });
} else {
  createServer();
}
In production, pair this with NGINX or an AWS load balancer as a reverse proxy. NGINX does the termination of the SSL connections, queuing of connections, and serving of the static assets - leaving Node.js with HTTP/2 to the backend instances. NGINX is known to scale well with high concurrency using HTTP keep-alive connections. AWS or GCP auto-scaling groups deal with traffic bursts in the infrastructure.
Advanced Backend Optimization Techniques for Node.js Applications
Event Loop Optimization and Avoiding Performance Bottlenecks
Use setImmediate() to yield CPU-heavy work back to the event loop between chunks:
js
function processLargeArray(items, callback) {
  let index = 0;
  function processChunk() {
    const end = Math.min(index + 100, items.length);
    for (; index < end; index++) {
      heavyCompute(items[index]);
    }
    if (index < items.length) {
      setImmediate(processChunk); // yields to pending I/O
    } else {
      callback();
    }
  }
  processChunk();
}
Track event loop lag with perf_hooks:
js
import { monitorEventLoopDelay } from 'perf_hooks';
const h = monitorEventLoopDelay({ resolution: 10 });
h.enable();
setInterval(() => {
  console.log('Event loop lag (ms):', h.mean / 1e6);
}, 5000);
Mean lag above 100ms is a reasonable alert threshold for I/O-bound APIs under normal load. For real-time systems like WebSockets or trading platforms, investigate anything above 20–50ms. For batch-processing services, 200ms may be acceptable. Calibrate your baseline under no load first, then apply thresholds from there.
Database Optimization Techniques for High-Performance Node.js Systems
In the case of MongoDB, it is better not to give complete documents in case one requires a limited number of fields. In the case of MySQL, a connection pool of 10-20 is good enough to process the vast majority of single-instance Node.js applications; the idea of adding more connection pools is something to consider only after it has been determined that wait times in a pool are actually relevant.
Performance Monitoring and Testing for Node.js Applications at Scale
Best Tools for Monitoring Node.js Performance in Production Environments
The quickest method of finding a diagnosis for a rogue process of Node.js is through the clinic.js doctor. Test it on a load-tested staging environment and then deploy changes to a production environment.
Load Testing and Stress Testing Strategies for High-Traffic Applications
Test suites, Load-tests: Run load-test suites before any major change in the backend. Both k6 and autocannon are good with Node.js APIs:
bash
# autocannon load test: 100 concurrent connections for 30 seconds
npx autocannon -c 100 -d 30 http://localhost:3000/api/users
Test at 2 times and 5 times of the anticipated peak traffic. Monitor error rate, p95, and p99 latency, and memory growth throughout each test run. When p99 latency increases 2 times between 1x and 2x load, then you have a concurrency bottleneck that you would like to investigate before it turns into a production incident.
Common Performance Issues in Node.js Applications and How to Fix Them
Identifying Memory Leaks and Debugging Performance Degradation
The majority of memory leaks in Node.js are in the form of three patterns, which are event listeners that may not be removed during the cleanup, closures containing references to large objects, or the unbounded growth of caches at the module level.
Steps to find them:
- Snapshot a heap in Chrome DevTools (connect to Node.js using the command: --inspect)
- Compare pre-load and post-load test snapshots.
- Search in objects with a large retained size, which should not be accumulating.
- Use heapdump in production for offline analysis when Chrome DevTools cannot connect directly.
Handling Traffic Spikes Without System Failures
- Configure NGINX upstream keepalive and worker process to be hardware compatible.
- On a 4GB machine, set --max-old-space-size=3072 to leave 1GB headroom for the OS and other processes.
- Deliver a content delivery network (Cloudflare, AWS CloudFront) to absorb the initial burst of a traffic spike of the static assets.
- Add graceful shutdown: empty out current requests, then kill a worker process, and in this way, load balancers can route cleanly.
Business Outcomes of Effective Node.js Performance Optimization
Improving User Experience Through Faster Response Times
Response time directly affects conversion rate. A 100ms increase in API latency measurably increases bounce rate and shortens session length across most web applications. As the speed of your Node.js backend increases, React frontends are rendered faster, and users do not leave.
Reducing Infrastructure Costs with Efficient Resource Utilization
An application that handles 2x the traffic on the same instance count cuts hosting costs in half - or scales to 2x users without doubling the bill.
Teams building Node.js systems at scale can work with performance specialists to identify bottlenecks before they reach production.
Conclusion: Building High-Performance Node.js Systems for Scale
Getting Node.js performance right at scale comes down to sequencing your fixes correctly. Start here:
- Profile first - Run clinic.js doctor to identify your actual bottleneck before touching code
- Fix async patterns - Replace sequential await chains with Promise.all for independent operations
- Add Redis caching - Target the top 5 slowest database queries; bring them under 1ms
- Cluster across CPU cores - Use the cluster module or PM2 to utilize all available cores
- Tune your database - Run EXPLAIN on slow queries, fix N+1 patterns, cap connection pool size
Each fix compounds the previous one. Caching means fewer database calls. Fewer database calls mean the connection pool stays healthy. A healthy connection pool means the event loop stays clear.
Struggling with Node.js performance under production load?
BuildNexTech's engineering team has reduced p99 latency from over 800ms to under 210ms on a Node.js backend handling 50,000 concurrent connections — by combining Redis caching, the cluster module, and NGINX keepalive tuning. If your backend is showing similar patterns under load, that's a starting point worth examining.
People Also Ask

What are the key benefits of Node.js for high traffic use?
Node.js handles high concurrency through its non-blocking I/O and event loop, making it well-suited for APIs and real-time systems with heavy read loads.
How can I optimize Node.js applications for better performance?
Begin with profiling using clinic.js so as to establish the real bottlenecks. Popular fixes are the use of sequential await chains being replaced with Promise. all, Redis caching before repeated database requests, NGINX as a reverse proxy using HTTP/2 and keep-alive, and the cluster module to use all CPU cores. Optimization decisions should be driven by profiling data, not guesses.
Which are the most suitable tools to use in monitoring the performance of Node.js?
In the case of production: AWS CloudWatch, OpenTelemetry, and Grafana, or DataDog. The core signal set that you will use would be the track event loop lag, heap used, request p95/p99 latency, and error rate.
What is the performance impact of caching Node.js applications?
Caching with Redis reduces repeated database queries and brings response times down to under 1ms for cached routes, as well as lessening databases and third-party API loads as traffic increases.
What are the reasons why the Core Web Vitals are important to the backend performance?
Time to First Byte is the responsiveness of Node.js backends and an instant indicator of both Core Web Vitals, such as LCP and INP, which influence the user experience and search placement, thus making it a close relationship between backend performance and SEO.


.webp)
.webp)
.webp)