

Let me be honest with you upfront: there's no single "best" Kubernetes tool. The right answer always depends on which layer of your stack is causing pain right now. After working through dozens of cluster audits at bnxt.ai, what we keep seeing isn't teams missing tools it's teams adding too many before they're ready to own them.
The best setups are built in layers Rancher or Cluster API for cluster management, Argo CD for GitOps, Prometheus and Grafana for monitoring, Loki for logging, Falco and Kyverno for security, Cilium for networking, and Velero for backup. Once your cloud bills start looking strange, add Kubecost.
Best Kubernetes Tools by Use Case: Quick Reference
Not every team needs the same stack. A three-person startup and a fifty-engineer platform team have completely different problems.
Kubernetes Management Platforms Leading in 2026
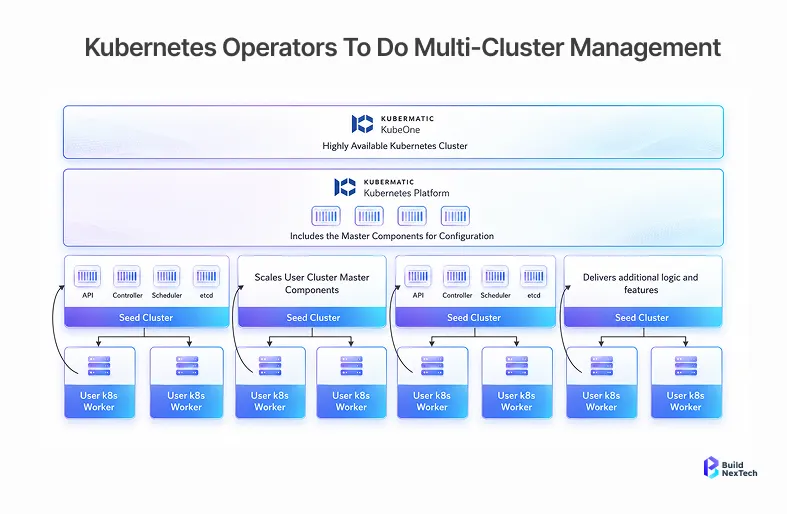
Most teams don't feel real Kubernetes management pain until they have more than one cluster. The first cluster is manageable manually. By cluster three or four spanning dev, staging, production, and a DR environment ,you need tooling that handles upgrades, RBAC, and health visibility across all of them without dedicating a separate engineer to each one.
Kubernetes Cluster Management Tools for Multi-Cluster Scaling
Picture a SaaS company running its API on AWS us-east-1, EU data on GCP europe-west, and a legacy workload on bare metal in Frankfurt. Every policy change becomes a manual task repeated across three environments. In bnxt.ai cluster audits, over 65% of teams managing three or more clusters had divergent RBAC policies between environments with no automated reconciliation in place.
- Rancher (SUSE) puts all your clusters behind one dashboard. Write a policy once and Rancher enforces it across AWS, GCP, and on-premises hardware handling upgrades and RBAC sync without an engineer manually touching each environment.
- Red Hat OpenShift is the choice when your industry requires it. Banks, hospitals, and government teams pick it because it ships with FIPS compliance, built-in image signing, and enterprise support things vanilla Kubernetes simply doesn't provide.
- Loft (vCluster) solves a different problem entirely. A fintech team of fifteen can give each developer an isolated virtual cluster for testing, spun up in under 30 seconds and torn down when the PR merges. No shared staging conflicts, no surprise bills from environments left running over the weekend.
A useful gut-check before buying anything: if your most experienced Kubernetes engineer takes a two-week holiday, can the rest of the team keep things running? If the answer is no, simplicity matters more than features at your current stage.
Top Kubernetes Automation Tools Reducing Operational Overhead
Every platform team has lived through this: a load spike hits on a Friday evening. The cluster autoscaler requests the same large instance type it always does, even though the workload actually needs two smaller ones. New nodes take four minutes. Users see timeouts. Karpenter reads the actual pod requirements and provisions the right nodes in under 30 seconds.
- Crossplane lets your team manage AWS RDS instances, S3 buckets, and GCP Cloud SQL using the same Kubernetes YAML they already write for deployments. One Git repository, one review process, one source of truth no Terraform pipelines drifting away from what's actually running.
- Flux CD and Argo CD end the "who ran kubectl apply and forgot to document it" conversation. According to CNCF's 2024 Annual Survey, 77% of respondents follow GitOps principles. That's the default expectation now, not an advanced practice.
- Robusta runs predefined playbooks when Prometheus alerts fire. For common failure patterns, this cuts mean-time-to-resolution before anyone even gets paged.
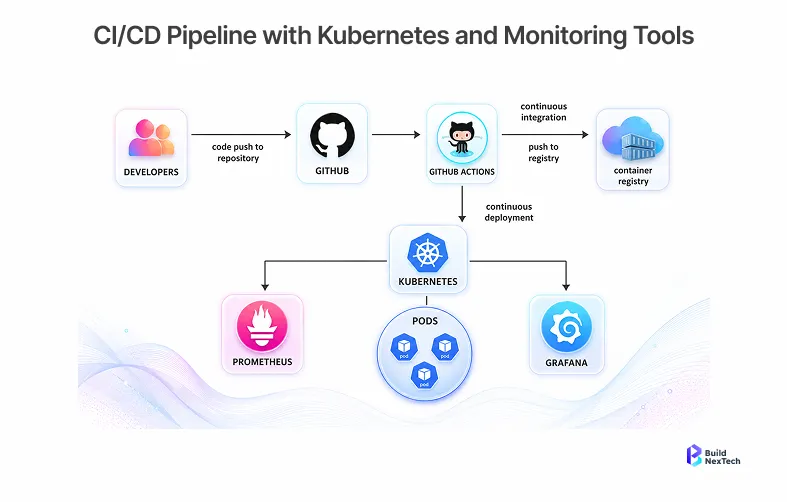
Kubernetes CI/CD Platforms: Comparing Speed, Complexity, and Cost
The mistake teams keep making is choosing the most powerful tool, then spending three months configuring it before a single pipeline runs in production.
- Argo CD and Argo Workflows once set up correctly, deploying to staging or production becomes a Git merge. The setup cost pays back within the first month of daily deployments across multiple environments.
- Tekton is a CNCF incubating project originally from Google, IBM, and Red Hat. The same pipeline YAML runs unchanged on GKE, EKS, and bare metal no cloud-specific adjustments needed.
- Codefresh has one standout feature: it measures error rates before and after a canary deployment and rolls back automatically when the numbers look wrong.
Start with GitHub Actions. Move to Argo CD or Tekton when you find yourself writing custom rollback scripts or managing environment promotion manually across more than two environments.
Monitoring and Observability Tools for Kubernetes Operations
Most teams set up metrics first, logging second, and distributed tracing never. This pattern shows up constantly in post-incident reviews: the alert fired, the dashboard showed a spike, but nobody could tell which service call caused it because tracing wasn't in place. All three layers need to be running before a production incident exposes the gap.
Kubernetes Monitoring Dashboards for Real-Time Visibility
It's 2 AM. Your on-call engineer gets paged. Latency on the checkout service is up 400%. A well-configured dashboard answers the question in seconds. A misconfigured one sends your engineer down a 45-minute kubectl describe rabbit hole through five namespaces.
- Grafana is the standard choice for almost every team. Import the kube-prometheus-stack dashboard and you have CPU, memory, pod restarts, and network throughput visible immediately.
- Komodor shows a timeline of every config change, deployment, and scaling event. When latency spikes 20 minutes after a rollout, you see the causal connection without manually cross-referencing timestamps across four different tools.
- Lens (Mirantis) is useful during development for a quick visual cluster view developers tend to keep it open alongside their IDE. It doesn't replace Grafana for production alerting.
Grafana tells you what the cluster looks like right now. Komodor tells you what changed and when things started going wrong. Most teams running both report noticeably shorter incident timelines.
Monitoring Kubernetes with Prometheus and Modern Alternatives
Prometheus is where almost every team starts, and for good reason it's free, well-documented, and has a decade of production use behind it. The problems appear around 50 nodes. Memory climbs, high-cardinality metrics from ephemeral pods hit performance limits, and the SRE team starts spending more time managing Prometheus than responding to alerts.
- Middleware combines Kubernetes monitoring, APM, logs, traces, and AI-powered incident investigation in a single platform. Teams get end-to-end observability without the operational complexity of managing multiple open-source tools and integrations.
- Victoria Metrics handles the same PromQL queries at significantly higher ingestion rates with lower memory usage. Teams that migrate don't need to touch their existing Grafana dashboards.
- Datadog is the right choice when you need infrastructure metrics, application traces, and logs in one interface particularly for teams running GPU-intensive AI workloads where Prometheus simply has no out-of-the-box GPU observability.
Start with Prometheus. When your SRE team spends more time managing federation and retention than responding to incidents, that's the signal to evaluate alternatives.
Kubernetes Logging and Observability: Tradeoffs and Scaling Challenges
A cluster running 200 pods can generate 50 GB of logs per day. Across five environments, that's a logging cost that rivals your actual workload spend. Most teams discover this only when the cloud bill arrives.
- Loki indexes only labels, not log content, which cuts storage costs dramatically at scale. A team already running Grafana gets log search in the same interface as their metrics dashboards.
- EFK Stack (Elasticsearch, Fluentd, Kibana) is the right choice for full-text log search across millions of lines but Elasticsearch is operationally demanding and its licensing has changed significantly in recent years.
- OpenTelemetry instrument new services with it from day one. When you switch backends later, you change the exporter configuration rather than touching application code.
Choose Loki when cost is a constraint and full-text search isn't critical. Choose Elasticsearch when sub-second search across large log volumes is a hard requirement.
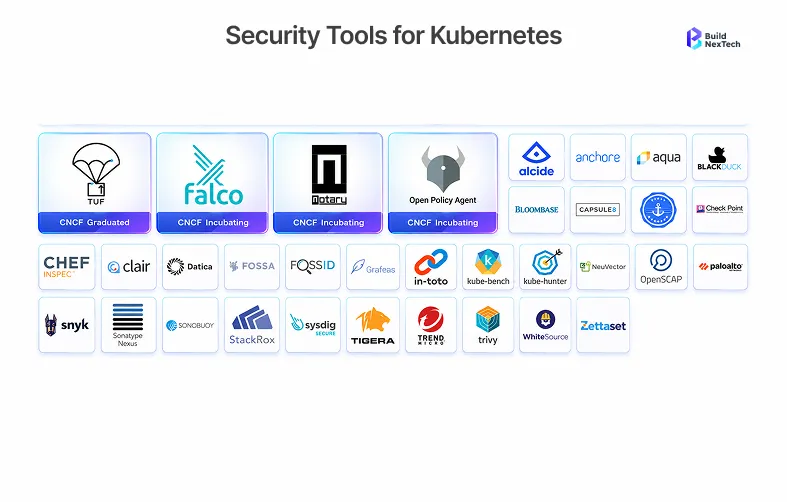
Kubernetes Security Tools for Cloud-Native Protection
Security in a Kubernetes cluster fails at specific, predictable points images with known CVEs nobody scanned, admission policies never written, pods freely reaching databases they shouldn't. Each gap is an independent attack surface. Closing one doesn't compensate for leaving another open.
Kubernetes Security Risk-to-Tool Reference Table
Each row in this table represents an independent security layer. A gap in any one of them is an independent attack surface, regardless of how well the others are covered.
Open Source Kubernetes Security Tools Worth Using in 2026
You don't need a large budget to build a solid Kubernetes security baseline. Four open-source tools cover the gaps that matter most, and between them they cost nothing to license.
- Falco (CNCF) watches what containers actually do at runtime using eBPF kernel tracing. When a container serving HTTP suddenly opens a network connection to an external IP, Falco fires an alert. Image scanning can't catch this because the behaviour happens after deployment.
- Kyverno writes policies in YAML. A team new to policy enforcement can have their first policy running in the cluster the same day no need to learn OPA's Rego language first.
- kube-bench runs the full CIS Kubernetes Benchmark checklist and outputs exactly which controls pass, fail, and why. Run it before any compliance audit, after a major upgrade, and during every new cluster provisioning.
The bnxt.ai recommended zero-budget baseline: Falco for runtime detection, Kyverno for admission control, kube-bench for compliance checks, and Trivy in your CI pipeline. Zero licensing cost, four critical gaps closed.
Kubernetes Vulnerability Scanning and Threat Detection Platforms
Most container security incidents trace back to two root causes: a vulnerable base image nobody scanned, or an RBAC misconfiguration that gave a service account more permissions than it needed. Both are preventable before any image reaches a cluster.
- Trivy (Aqua Security) is free and fast. Add it as a GitHub Actions step and it scans every image before it reaches your registry. Set the pipeline to fail on critical CVEs and you have an automatic quality gate with no manual enforcement required.
- Snyk Container surfaces fix recommendations alongside vulnerability findings developers see which base image version resolves the issue and a direct link to the fix, making remediation part of normal PR review.
- Sysdig Secure bundles image scanning, runtime threat detection, and compliance reporting in one dashboard with exportable audit trails the right call for teams presenting unified reports to auditors.
Kubernetes Runtime Security and Zero-Trust Best Practices
Here's a scenario common in regulated industries: a compromised third-party dependency opens a reverse shell from inside a running pod. The image scan was clean because the vulnerability was introduced post-deployment through a supply chain update. Without runtime detection, the breach is invisible for days. With Falco, an alert fires the moment the shell is spawned at the system-call level.
- Network Policies are free, native to Kubernetes, and present in almost no default cluster configuration. A policy restricting the orders service from reaching any pod except the database means a compromised API container can't query it directly.
- Cilium uses eBPF-based identity-aware network policies that follow workload identity rather than IP address. In Kubernetes, pod IPs change constantly traditional iptables rules go stale; Cilium policies stay accurate.
- SPIFFE and SPIRE give each service a short-lived cryptographic certificate. Service A can call Service B only by presenting a valid certificate no tokens in environment variables, no passwords in ConfigMaps.
Layer these three together: SPIFFE stops lateral movement through stolen credentials, Cilium limits what a compromised pod can reach, and Falco detects unusual behaviour when something gets through anyway.
Kubernetes Cost Management Tools to Consider in 2026
Teams that move workloads to Kubernetes without cost controls often discover six months later that their cloud bill grew significantly while traffic grew only modestly. The gap is almost always resource over-provisioning.
- Kubecost or OpenCost breaks down spend by namespace, workload, and team. When a finance team asks why the engineering bill jumped last quarter, you can show exactly which squad's workloads drove the increase instead of guessing.
- Goldilocks runs VPA in observation mode and shows what pods actually consume versus what they request. A service requesting 500m CPU that never uses more than 80m is visible in the dashboard before you auto-apply any changes.
In seven out of ten bnxt.ai cluster reviews, we find at least one persistent volume from a development experiment still attached and billed months after the work finished. A monthly cleanup job prevents this.
Networking, Service Management, and Infrastructure Tools
Networking decisions made at cluster setup are among the hardest to change later. Migrating CNI plugins on a running production cluster is disruptive. Picking the wrong ingress controller creates migration debt the team carries for years.
K8S Ingress vs Gateway API: Choosing the Right Approach
- K8s Ingress is the right choice when you have one team, standard HTTP routing, and a stable service topology. NGINX Ingress is well-documented and battle-tested. Don't switch until you have a concrete problem Ingress can't solve.
- Gateway API is built for multi-team environments where squads need independent routing control. It natively supports TCP, UDP, TLS passthrough, content-based routing, and weighted traffic splitting.
- Traefik routes are discovered automatically from container labels new services register themselves without manual YAML updates, which teams running microservices with frequent additions find genuinely useful.
Start new Kubernetes projects with Gateway API. Migrations that solve no current problem only create risk.
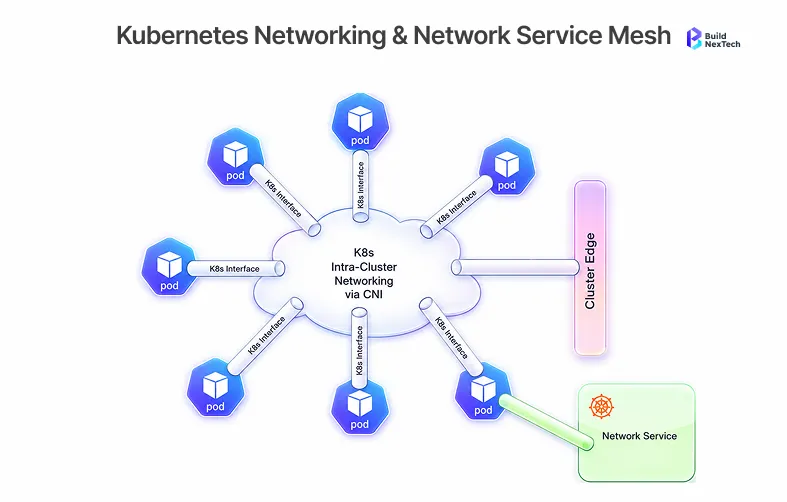
K8S CNI and Service Mesh Tools for Modern Networking
- Cilium is now the default CNI on Amazon EKS and Google GKE. eBPF-based policy enforcement runs at kernel level, faster than iptables alternatives. A single Cilium agent handles networking, network policy, observability, and service mesh mode.
- Calico has strong BGP routing support, making it the right choice for on-premises and bare-metal environments where Kubernetes pod networking needs to integrate with existing data centre switching infrastructure.
- Linkerd when mTLS between services or detailed service latency observability is genuinely required, Linkerd's Rust-based proxy adds these at lower CPU cost than Istio's Envoy sidecar.
Don't adopt a service mesh because you might need it someday. Adopt it when you have a specific problem it solves that nothing else in your stack already handles.
K8S Backup, Node Management, and Infrastructure Resilience
A Kubernetes upgrade from 1.27 to 1.28 broke a custom admission webhook at a mid-size SaaS company. The webhook was undocumented, its author had left, and there was no backup of cluster state before the upgrade. Recovery took eleven hours. A Velero backup taken beforehand would have made it a 20-minute restore.
- Velero backs up all Kubernetes resources and persistent volumes to object storage. Schedule daily automated backups. Test a full restore quarterly. Document the exact commands while things are calm not while an upgrade is failing.
- Cluster API (CAPI) manages the cluster itself as versioned infrastructure code. Provisioning a node group, upgrading the control plane, or replacing a failed node happens through a Git commit and a reconciliation loop rather than manual cloud console operations.
- Kasten K10 (Veeam) handles application-consistent snapshots for PostgreSQL and MongoDB running in-cluster the right choice for stateful production workloads where volume-level backups alone aren't sufficient.
Conclusion
When bnxt.ai reviews a team's Kubernetes stack, the most common finding isn't missing tools it's tools that were added before the team had the operational maturity to maintain them. Argo CD configured but nobody owns it. Istio running but mTLS isn't enforced. Velero installed but never tested. Adding tools without ownership is how a well-intentioned stack becomes a maintenance burden.
How to Select Kubernetes Tools Based on Team Maturity
Early stage (fewer than five engineers): Use a managed Kubernetes service EKS, GKE, or AKS. Add Helm, GitHub Actions, and Grafana Cloud. Your job is to ship product, not build a platform team.
Growing teams (five to twenty engineers): Add Argo CD when deployment consistency becomes a real problem. Add Trivy when a CVE slips through code review. Add Loki when debugging requires SSH access to nodes. Add Network Policies before your first security audit.
Platform teams (twenty or more engineers): Invest in Crossplane, Cilium, Falco, and multi-cluster management. At this scale, the cost of undocumented manual processes exceeds the cost of building proper tooling around them.
The question bnxt.ai asks every team isn't which tools are on their list it's who owns each tool, who can troubleshoot it under pressure, and whether the runbook exists.
Emerging Kubernetes Trends Shaping 2026 Platforms
AI-assisted operations: K8sGPT analyses a CrashLoopBackOff event and produces a plain-English summary with a suggested fix in about ten seconds. For an on-call engineer who isn't a Kubernetes specialist, that's the difference between a ten-minute resolution and a two-hour escalation chain.
Platform engineering: Spotify, Shopify, and Airbnb have each published their internal developer platform approaches built on Kubernetes developers push to Git, the platform handles everything else. Backstage and Port are the most widely adopted tools for this abstraction layer.
eBPF adoption: Cilium is the default CNI on both Amazon EKS and Google GKE. Teams migrating from Flannel or Calico report lower per-node CPU usage and faster policy enforcement without touching application code. If your cluster is still running a non-eBPF CNI, evaluating Cilium belongs on your next platform roadmap cycle.
Building a Scalable, Secure, and Observable Kubernetes Stack
A production-grade Kubernetes stack covers eight layers. This table is bnxt.ai's recommended starting point — adjust based on team size, compliance requirements, and cluster count.
Table: Recommended Kubernetes stack by layer bnxt.ai 2026 practitioner framework
Start with the simplest version of each layer. Add complexity only when a specific operational limit justifies it. bnxt.ai works with teams to assess their current stack, identify the gaps carrying the most operational risk, and build a roadmap from where they are today to one that holds up at scale.
People Also Ask

1)Which Kubernetes management tools are best for multi-cloud environments?
Rancher or Kubermatic KDP for unified cluster management, Crossplane for infrastructure provisioning across AWS, Azure, and GCP, and Argo CD to tie it together with GitOps. That combination runs consistently across every cloud provider without locking you into any one of them.
2)How do organisations control Kubernetes infrastructure costs?
Start with visibility Kubecost or OpenCost shows exactly what each team and namespace is spending. Karpenter reduces over-provisioning by matching instance types to actual pod requirements. The single highest-impact change though is simply setting CPU and memory requests on every workload. Clusters without them routinely reserve far more capacity than they ever use.
3)What are the biggest Kubernetes challenges teams face at scale?
Multi-cluster complexity, observability costs at high log volumes, security posture drift, and developer experience friction. Most organisations tackle all four simultaneously through platform engineering — abstracting Kubernetes complexity away from application developers so they can focus on shipping code.
4)How are AI and automation changing Kubernetes operations in 2026?
They're shifting teams from reactive firefighting to pattern-based remediation. K8sGPT explains cryptic errors in plain English. Robusta runs playbooks from Prometheus alerts before anyone gets paged. Komodor connects deployment changes to performance degradation automatically. That said, these tools amplify experienced engineers — they don't replace Kubernetes knowledge.
5)What should teams evaluate before migrating workloads to Kubernetes?
Four things: containerisation readiness, your team's ability to operate Kubernetes under incident conditions, observability and security tooling being in place before go-live, and a tested backup plan for stateful workloads. And don't migrate customer-facing services first — start with something non-critical, run it for 30 days, learn from it, then expand.


.webp)
.webp)
.webp)