

Cloud migration is the strategic shift from legacy on-premise environments to modern cloud platforms such as AWS, Azure, and Google Cloud. While the transition unlocks scalability, automation, and global reach, real success is proven only after workloads start running in the new cloud environment. At this stage, organizations must ensure that performance, security, cost behavior, and user experience are not only preserved but improved.
This is where visibility becomes non-negotiable, turning assumptions into data-driven certainty. BuildNexTech supports enterprises in this stabilization phase by translating cloud migration outcomes into measurable operational efficiency from day one.
With the right visibility and operational intelligence in place, organizations not only safeguard continuity but also accelerate cloud ROI. This sets the stage for the next focus area — post-migration dashboards — which empower teams to convert cloud performance, security, and cost signals into actionable insights at scale.
Key Insights from This Article:
🚀 Post-migration success depends on continuous visibility—not just migrating workloads to AWS, Azure, or Google Cloud.
📡 Complete telemetry across metrics, logs, and traces is essential for accurate and reliable dashboards.
🎯 Tailor dashboards to migration KPIs and team roles for clear, actionable insights.
🔔 Leverage alerting and RBAC to make dashboards proactive tools for uptime, security, and compliance.
🏢 BuildBNeXTech accelerates post-migration success with scalable multi-cloud dashboard implementation.
Introduction: Why Post-Migration Dashboards Are Critical
After migrating from on-premise to cloud, whether it’s a Google Cloud migration or an AWS/Azure cloud migration, the priority immediately shifts from movement to performance. Post-migration cloud monitoring dashboards ensure applications operate reliably, securely, and efficiently across complex cloud infrastructure. Without visibility into metrics, logs, and traces, organizations risk slowdowns, outages, compliance violations, or degraded user experience.
- Dashboards validate cloud performance monitoring instantly after cutover
- They track application performance, network traffic, security posture, and service health
- They support cloud security monitoring best practices and regulatory demands
- They guide optimization for cloud cost and long-term cloud infrastructure management services
Well-implemented dashboards allow teams to measure success against the cloud migration plan and unlock the true value of the new cloud environment. BuildNexTech builds dashboards that support every cloud, including AWS Cloud Monitoring, Google Cloud Monitoring, and Azure Cloud Monitoring, helping companies make post-migration success measurable and repeatable.
Key Benefits of Effective Post-Migration Monitoring Dashboards
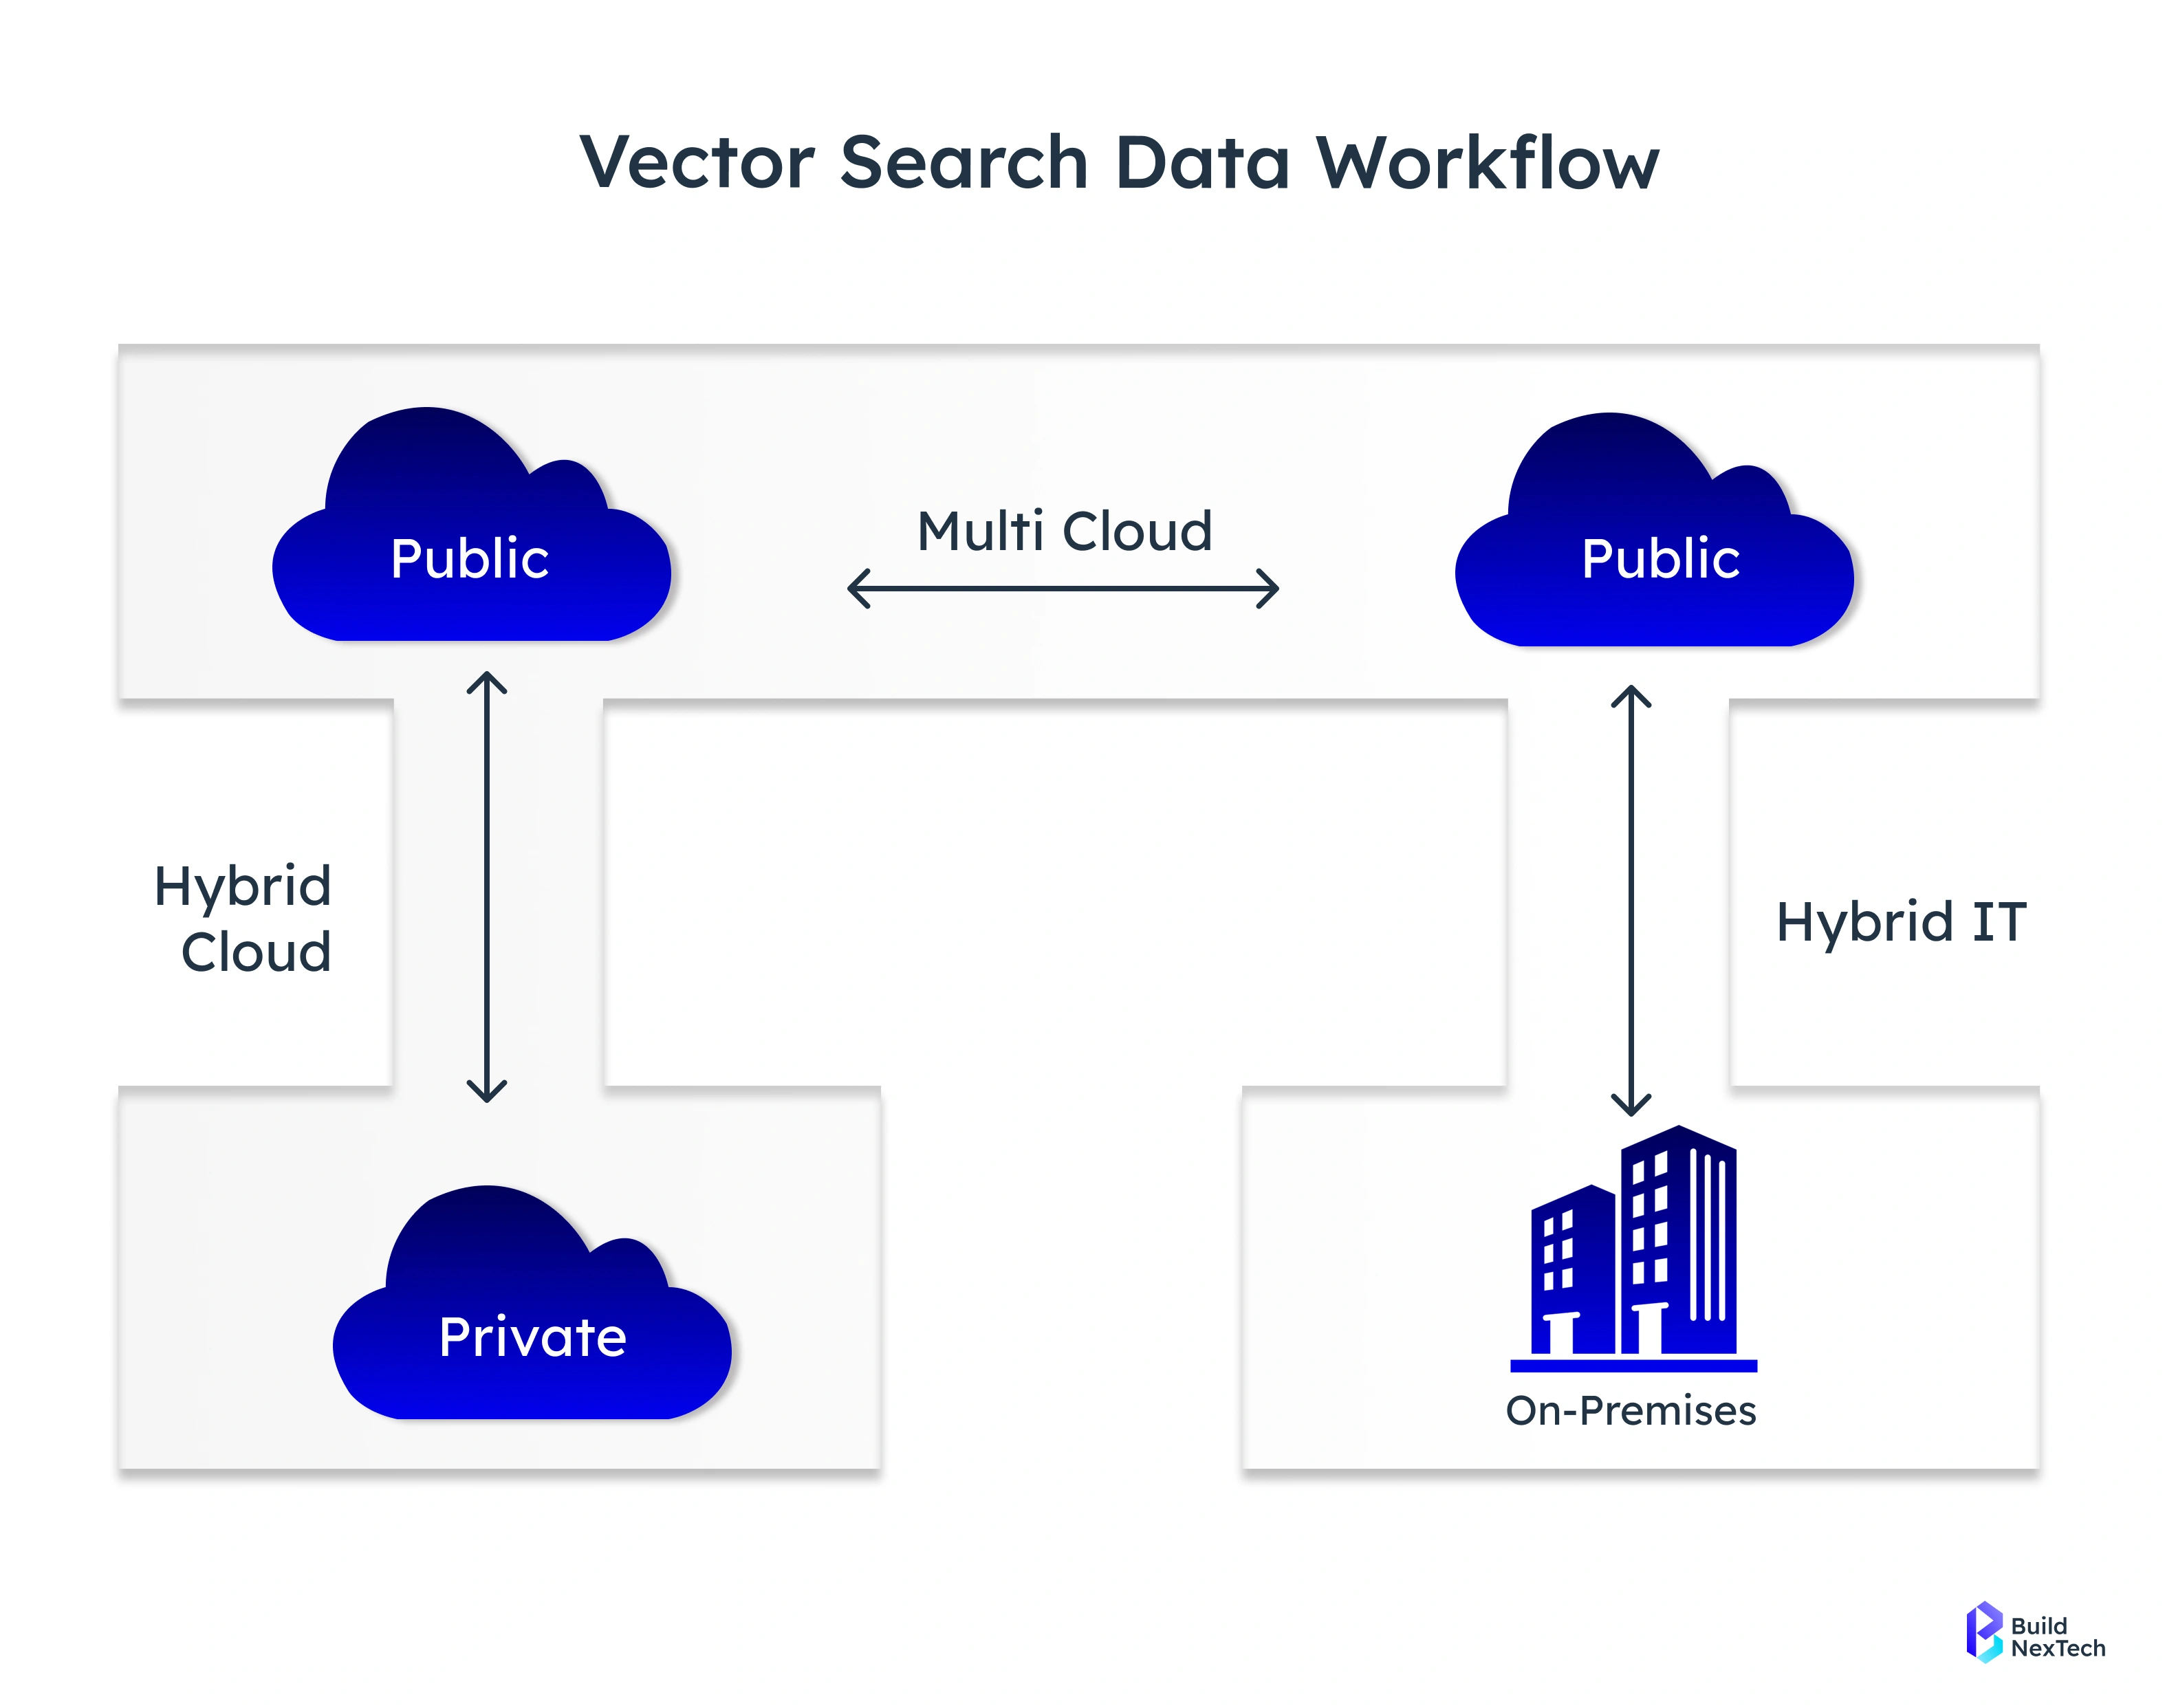
Post-migration monitoring brings data clarity at a time when variables are high. Companies need confidence that workloads are stable, scalable, and secure in the new cloud environment-whether AWS, Azure cloud services, or Google Cloud Platform.
- Validate performance baselines across cloud services and applications
- Detect configuration errors and latency issues quickly
- Measure real user monitoring and synthetic monitoring results
- Monitor cloud security posture, monitoring, and compliance requirements
These dashboards accelerate value realization from cloud migration services and enable predictable cloud application performance.
Phase 1: Laying the Foundation – Data Collection and Preparation
A telemetry pipeline collects metrics, logs, and traces from cloud workloads and systems, providing the raw data needed for observability. In Phase 1, setting up this pipeline ensures dashboards receive accurate, end-to-end information, forming the foundation for reliable post-migration monitoring.

Setting up dashboards starts with verifying end-to-end observability coverage. A cloud monitoring platform is only as accurate as the data feeding it.
- Collect metrics using Prometheus, Node Exporter, and Prometheus Exporter
- Aggregate logs via Fluentd, Grafana Loki, syslog event logging, or Splunk Add-on for AWS
- Capture traces for distributed applications and Kafka-based data pipelines
Preparing the right foundation ensures every dashboard informs, not misleads, post-migration decision-making.
Verifying Data Sources and Connectivity in the New Cloud Environment
Once workloads shift from data centers to cloud services, connectivity and observability pipelines must be revalidated.
- Validate dashboard connectivity for cloud-managed Catalyst, cloud-native IOS-XE, and hybrid systems
- Check running metrics on Cisco Catalyst switches, Cisco Catalyst 9200, and the C9000 switching platform
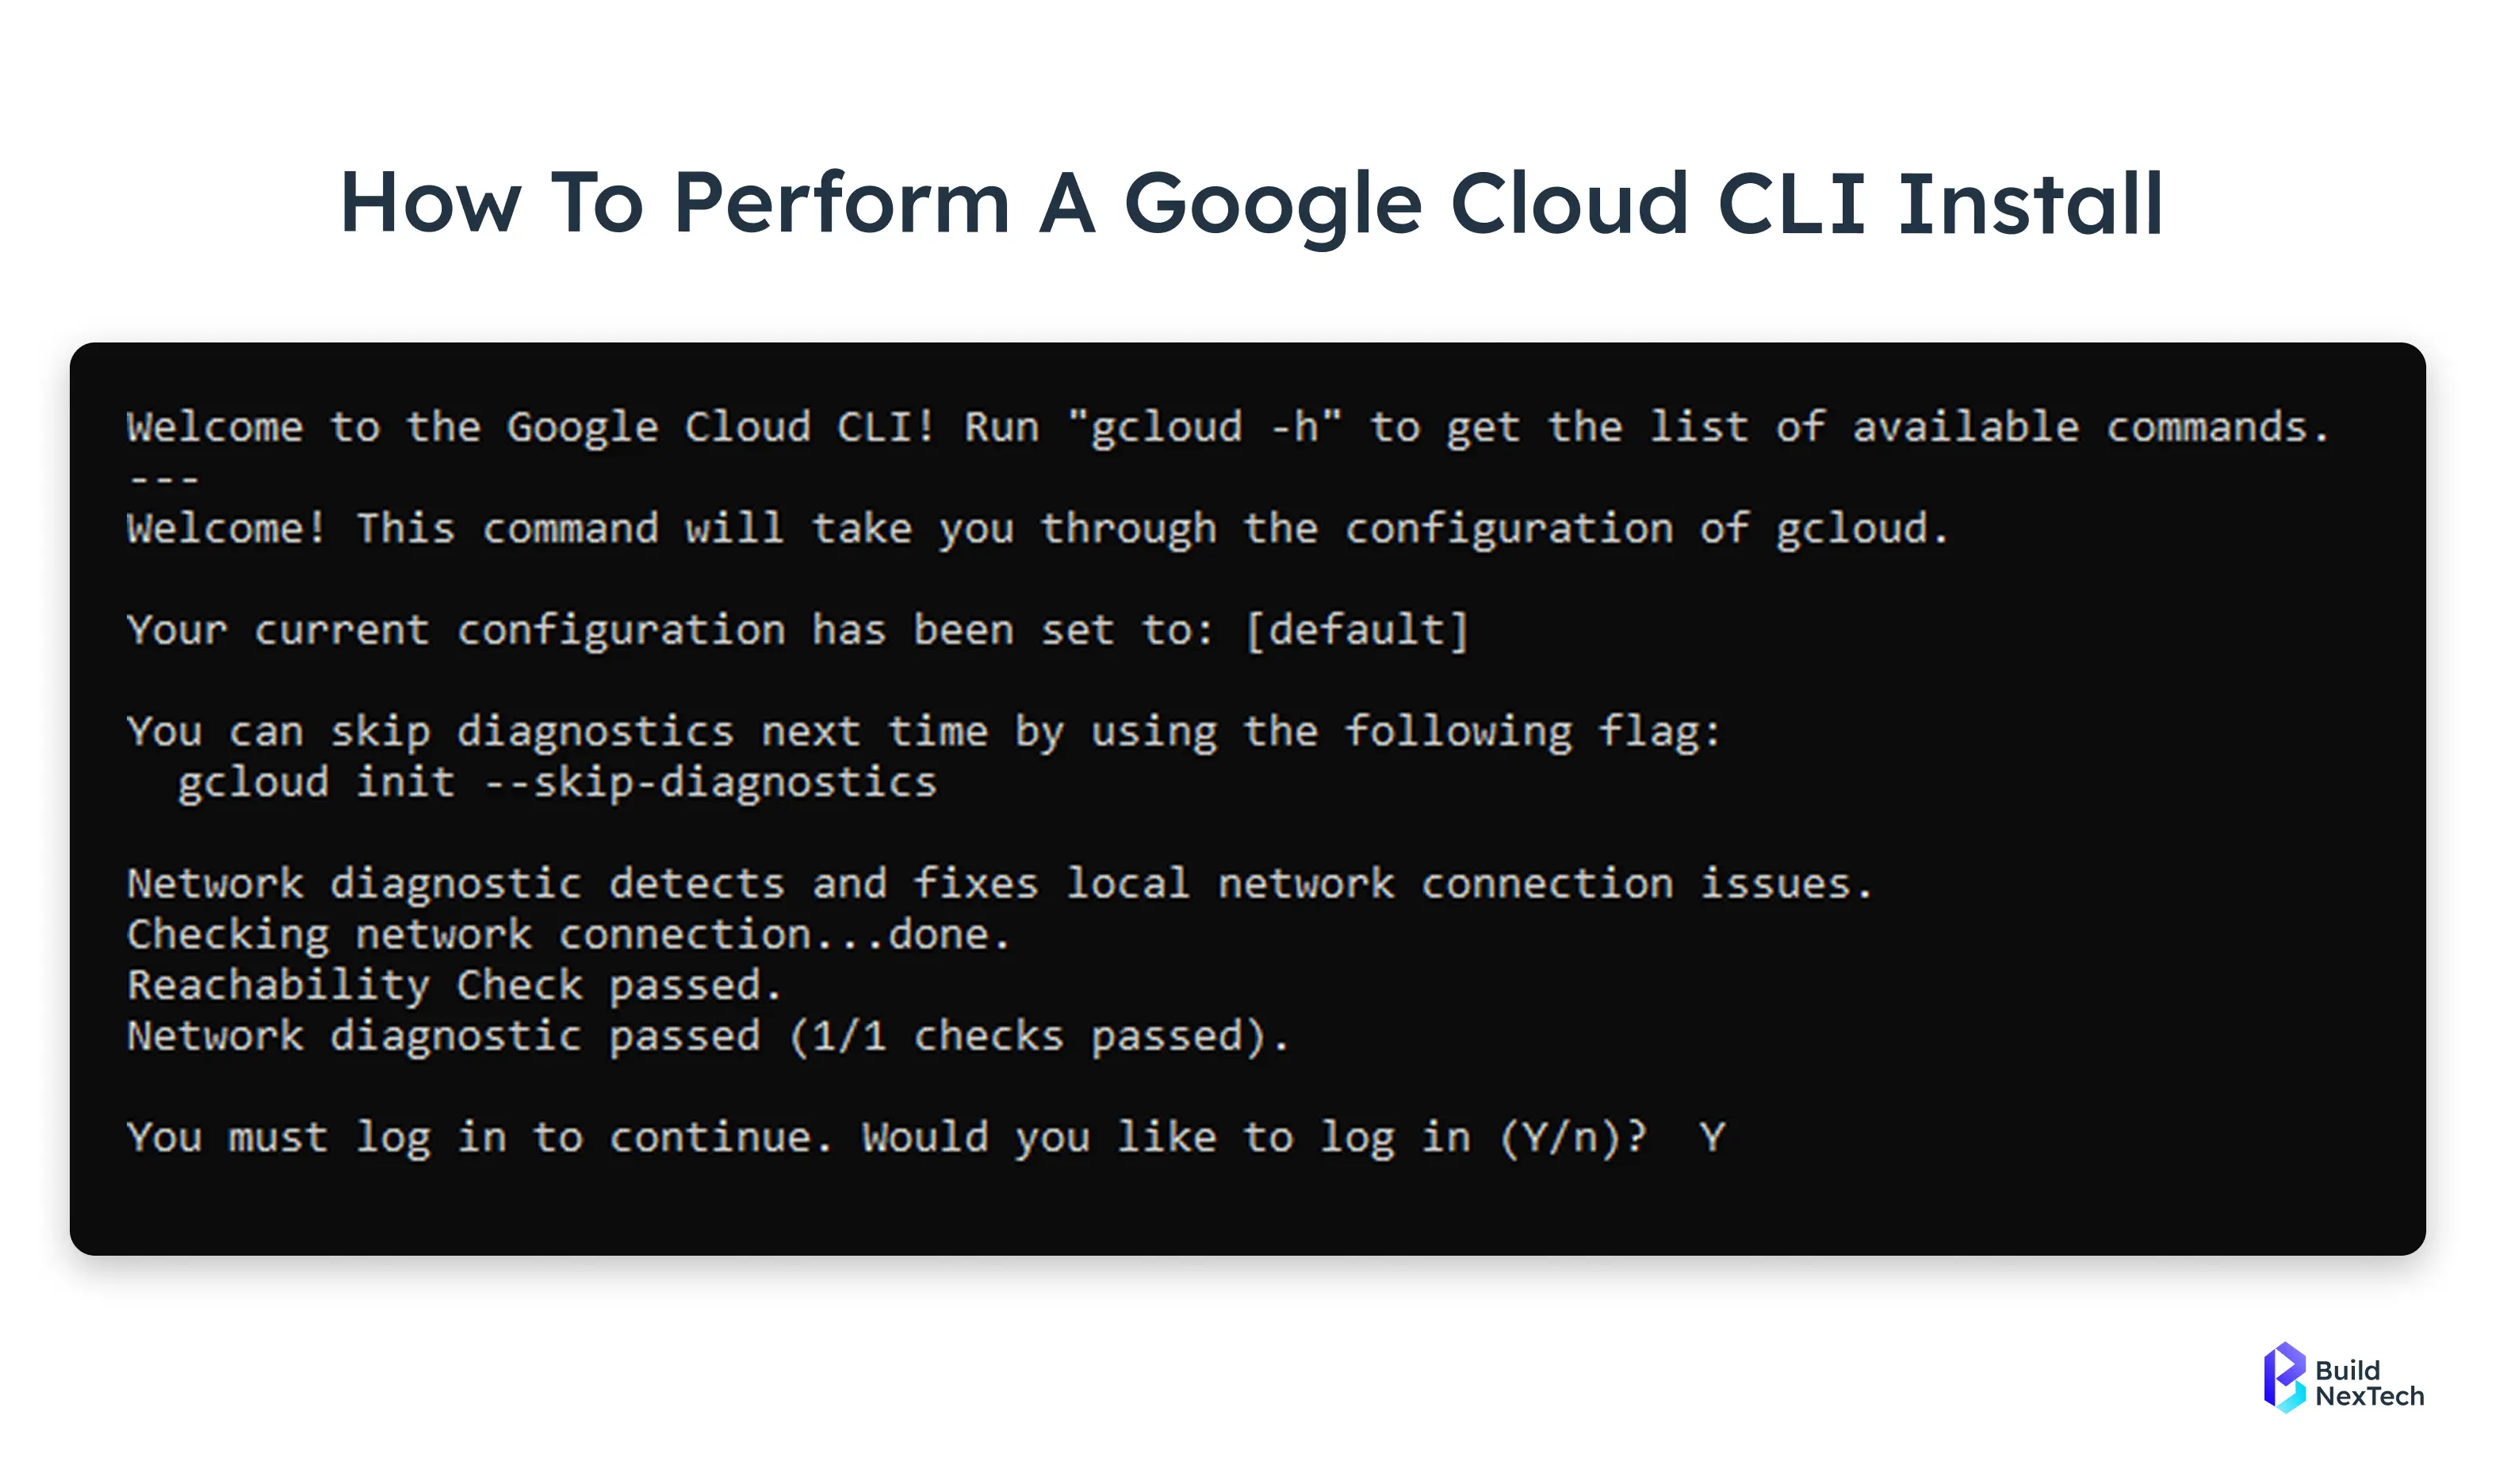
- Confirm API key, Cloud CLI, OAuth, and SAML authentication configurations
- Inspect service principal and application registration across Microsoft Entra ID and enterprise applications
- Verify Layer 3 uplink SVI, MSTP, and packet capture for network availability metrics
Connectivity verification eliminates blind spots that commonly appear after migration.
Setting Up Comprehensive Metrics, Logs, and Traces Collection
Cloud workloads generate diverse and dynamic data, requiring a comprehensive observability strategy. Capturing metrics, logs, and traces across applications and infrastructure ensures that dashboards provide actionable insights for performance, security, and compliance.
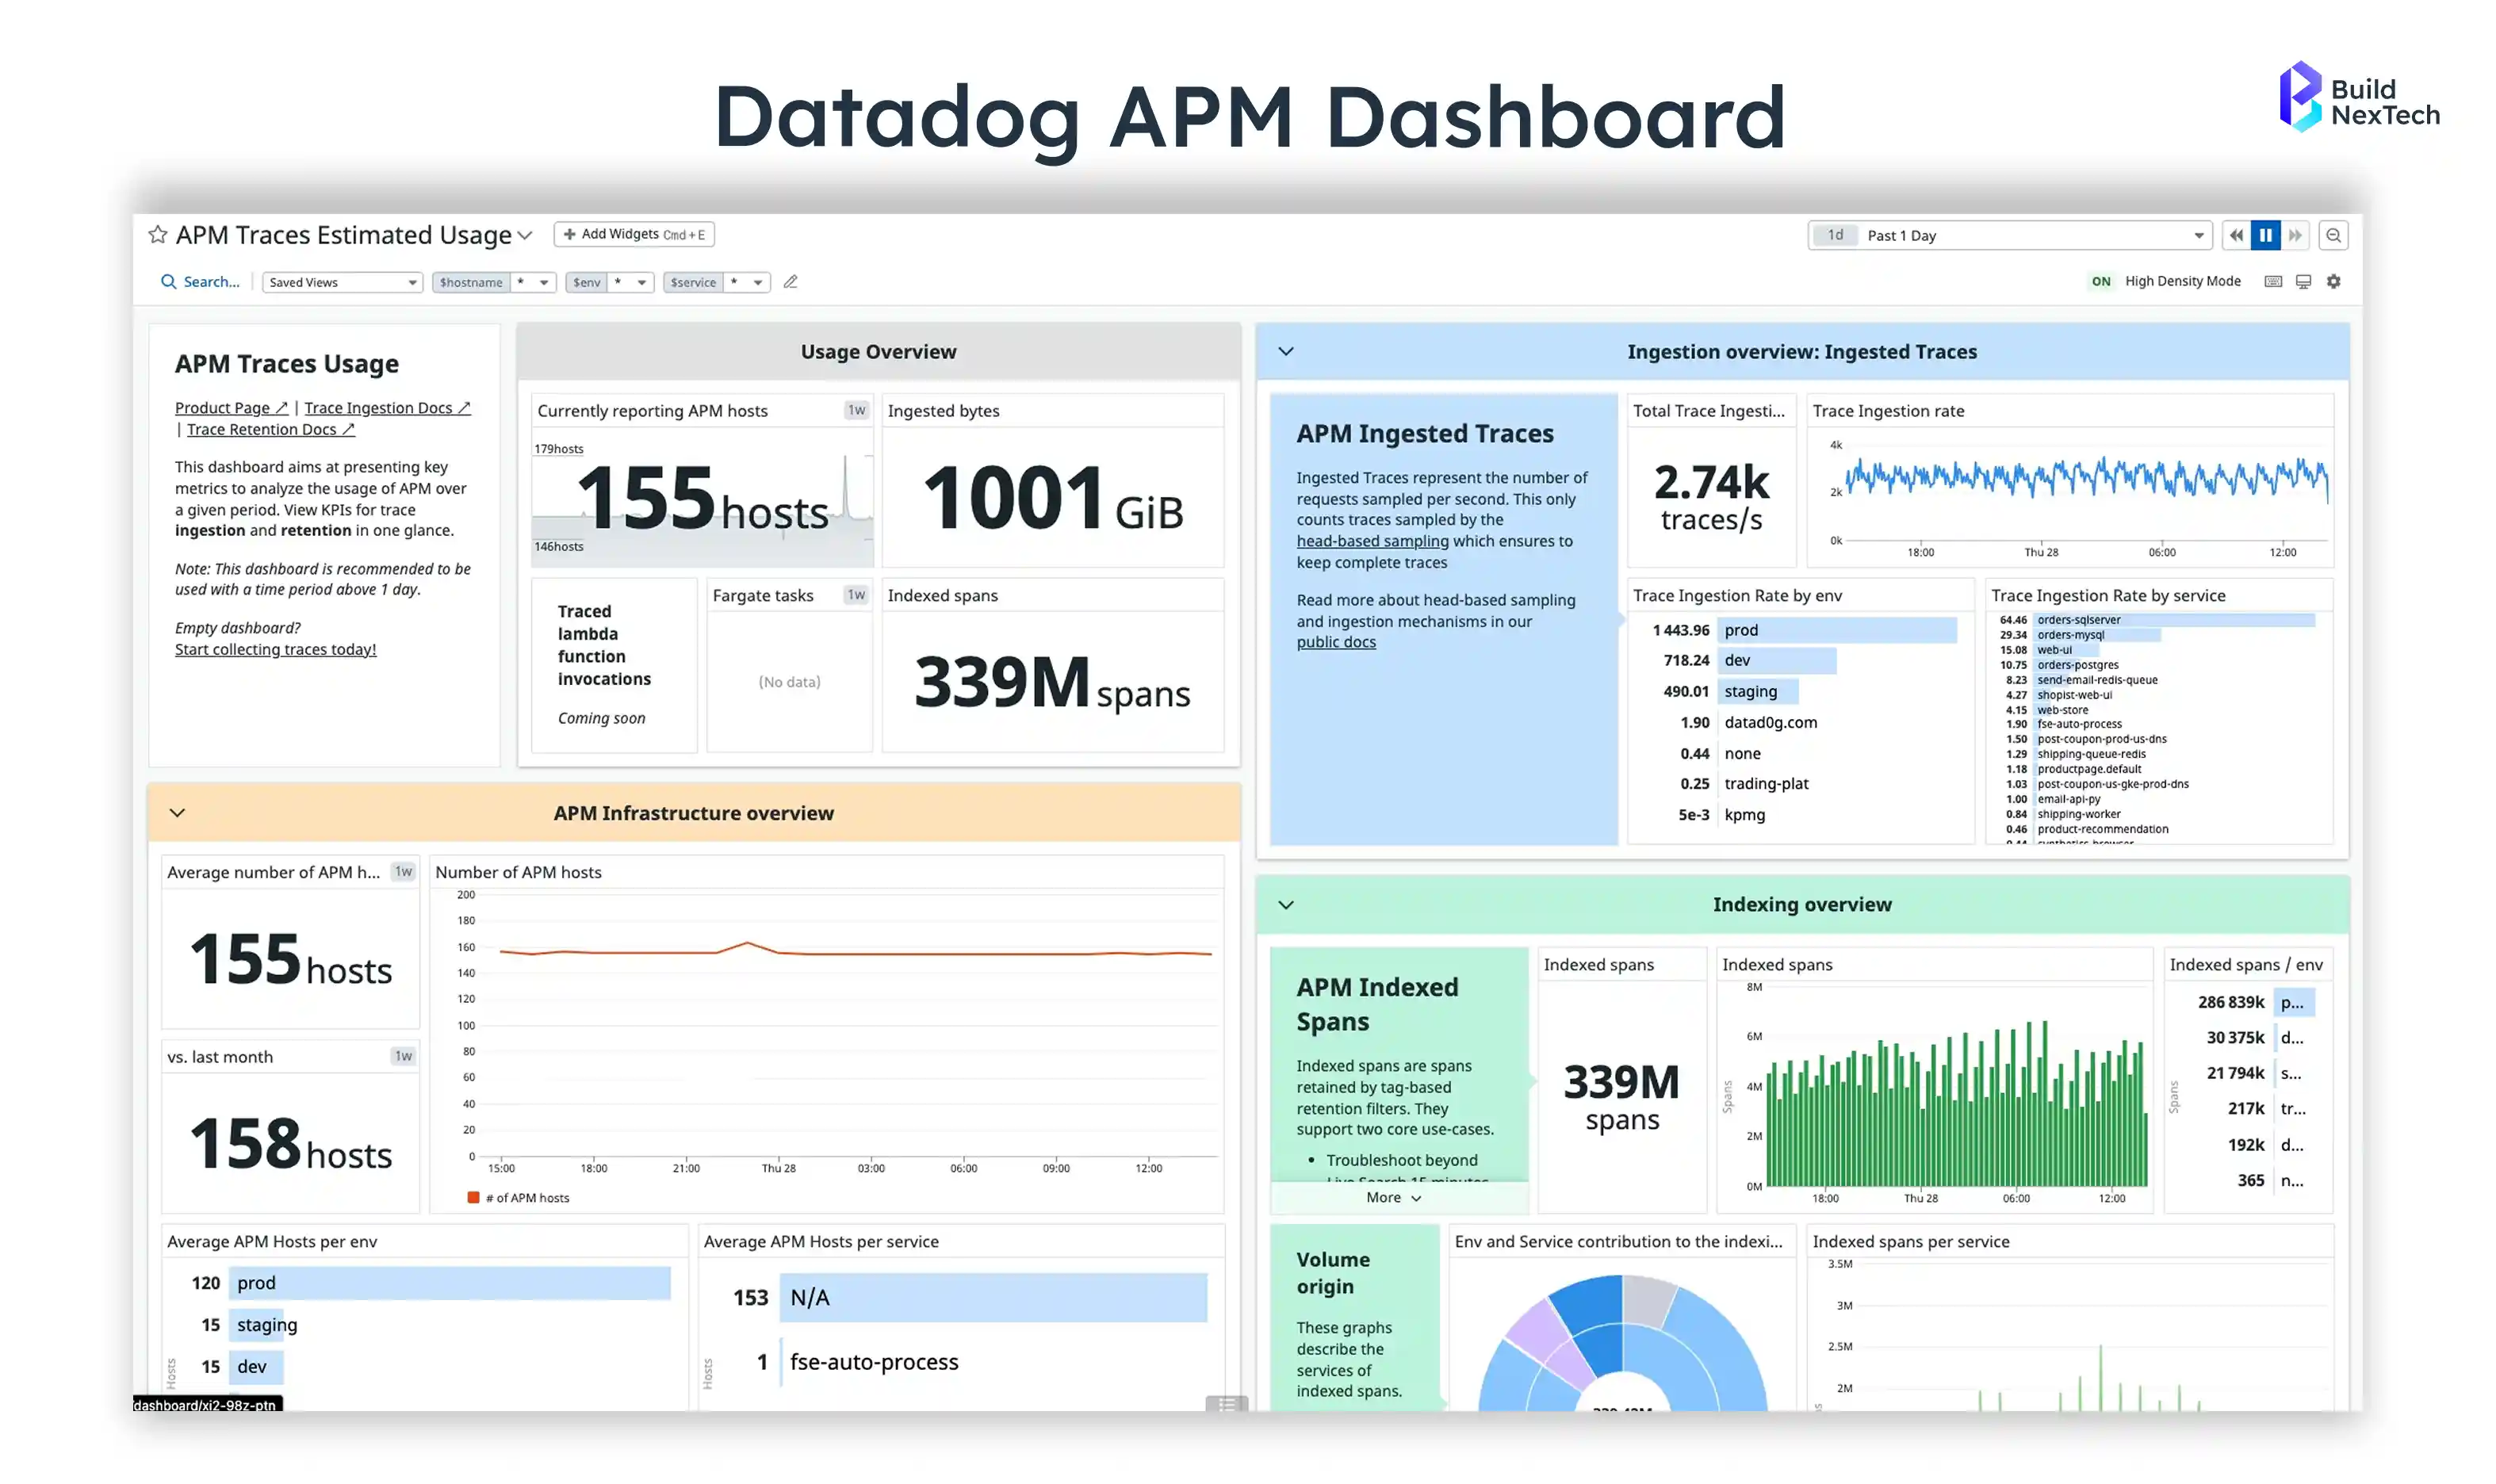
- Configure application performance monitoring using Datadog, Splunk App for AWS, or Grafana Cloud
- Collect user experience telemetry through synthetic monitoring and real user monitoring
- Enable cloud data monitoring, log aggregation, and metrics collection pipelines for cloud workloads
- Apply security and compliance monitoring to validate data in transit and access control
Full-funnel data capture is what transforms raw telemetry into actionable observability.
Phase 2: Strategic Dashboard Design for Migrated Environments
Dashboards must tell a story, not just present raw data. The design phase determines usability and operational value.
- Align dashboards with migration KPIs and business goals
- Apply a logical visual hierarchy with clean, intuitive layouts
- Tailor panels and widgets to specific user personas- DevOps, cloud engineers, CIOs, security teams
- Enable drill-downs to logs, traces, and packet captures for root-cause analysis
- Combine near-real-time insights with historical trend analysis for tactical and strategic decision-making
The right design approach shapes the dashboard into a platform for intelligent decisions.
Defining Key Performance Indicators (KPIs) for Post-Migration Success
Success metrics set the tone for post-migration monitoring maturity.
- Measure system uptime, latency, throughput, and 95th/99th percentile response times
- Track cloud security posture metrics and access control event patterns
- Analyze changes in application dependencies and network traffic flows after migration
- Compare cloud cost vs. consumption ratios against the migration plan
- Validate business readiness using clearly defined Service Level Objectives (SLOs)
KPIs make cloud migration performance measurable rather than subjective.
Strategic Design: Tailoring Dashboards for Audience, KPIs, and Visual Clarity
A single generic dashboard cannot serve every team. Personas determine design.
- CIO dashboard: business value, uptime scorecards, cloud cost trends
- DevOps dashboard: workloads, deployments, microservices, Kafka pipelines
- Security dashboard: access logs, RADIUS/SAML authentication, conditional access policies
- Network dashboard: VLANs, ICMP failure rates, TCP 443 traffic visibility
- Application dashboard: request volumes, failure rates, user experience deviations
With tailored dashboards, every role receives clarity rather than noise.
Phase 3: Building Cloud Monitoring Dashboards
After developing dashboards and implementing telemetry, the next phase of development is creating and integrating the dashboards using all cloud and hybrid tools used for monitoring. The creation of well-designed dashboards allows teams to transform their raw telemetry data into information they can act upon, utilizing this data to gain insights into performance, security, and availability.
- Grafana Dashboards with PromQL, Grafana Alerting, Grafana Data Sources
- AWS CloudWatch, Azure Monitor, Google Cloud Monitoring tools
- Commercial cloud monitoring software such as Datadog, Splunk, and Grafana Enterprise
- Hybrid and edge dashboards for CLI-managed Catalyst switches, Meraki Cloud networks, and distributed branch environments
- Long-term storage using Cortex or Thanos for retention and scalability
This phase brings the cloud observability vision to life.
Selecting the Right Dashboard Platform (Cloud-Native or Third-Party)
The selected dashboard will vary depending on the type of infrastructure you have deployed in your company's cloud environments, the nature of your team's workload and size, and the overall objective of your business's operation. The dashboard platform needs to align its architecture and long-term vision with your business's planned growth and direction.
- Cloud-native: AWS CloudWatch, Azure Monitor, Google Cloud Monitoring - use for single-provider environments with straightforward integrations
- Third-party: Grafana OSS/Enterprise, Grafana Cloud, Splunk App - use for multi-cloud setups or custom visualizations
- Fleet monitoring: Meraki Dashboard - use for distributed network assets across branches
- DevOps ecosystems: Prometheus + Alertmanager + Grafana Stack - use for microservices and CI/CD-focused environments
- Vendor-supported bundles: Cisco DNA Center and cloud monitoring solutions - use when leveraging vendor-specific enterprise infrastructure
Future scalability and license cost determine long-term platform viability.
Connecting Metrics, Logs, and Traces to the Dashboard
Properly connecting metrics, logs, and traces ensures dashboards display accurate, real-time system health. Integrating cloud, network, and application telemetry provides teams with a unified view for monitoring and troubleshooting.
- Use Grafana Data Sources, CloudWatch Metrics/Logs, and Splunk KV Store
- Link cloud performance monitoring tools and cloud network telemetry
- Configure cloud application monitoring tools for microservices and containers
- Feed Service Map and Network Map sources for dependency visibility
- Integrate cloud application development CI/CD telemetry for deployment awareness
Seamless connectivity results in a unified observability experience.
Creating Visual Panels and Layouts
Dashboards present key metrics and trends at a glance, allowing for rapid comprehension of the performance of a system. Selecting the right panels and arranging them correctly makes it possible for users to view critical information in their dashboards easily.
- Time-series panels for latency, traffic, and memory utilization
- Heat maps for user experience degradation and access failure spikes
- Topology graphs for network device configuration changes
- Error breakdowns for migration-specific failure clusters
- Migration status indicators to align with the cloud migration process
A well-designed layout reduces troubleshooting time dramatically.
Leveraging Pre-built Dashboards and Templates
Ready-made dashboards and Templates Shorten Your Time to Setup and Minimize Your Trial and Error Attempts with Easy-to-Use Metrics and Visuals for Cloud Workloads, Networking Equipment, and Hybrid Environments.
- Grafana Dashboards Library for quick cloud monitoring solutions
- Splunk App for AWS and Datadog templates for cloud workloads
- Cisco Catalyst switch monitoring templates for firmware upgrade insights
- Meraki APIs-powered topology dashboards for branch environments
- Google Cloud Monitoring solutions library for automated service insights
Templates provide a strong starting point and lower the learning curve.
Phase 4: Operationalizing, Alerting, and Continuous Improvement
Dashboards function as an ongoing operational resource that gives access to data-driven information that supports and informs team decision-making regarding their operations, enabling them to respond quickly to any operational or regulatory changes.
- Trigger alerts early to prevent SLA and SLO breaches
- Embed dashboards into daily DevOps and SRE workflows
- Expand dashboards as new workloads and services scale
- Align observability maturity with business goals and governance standards
- Integrate cloud devops services for automated remediation
Post-migration monitoring becomes a continuous practice-not a setup exercise.
Implementing Robust Alerting Mechanisms
Effective alerts give teams an early warning about potential issues. Alerting systems are designed to limit overload on teams, provide predictive thresholds to catch issues early, and use automated policy actions for alerting.
- Trigger alarms on performance anomalies and security deviations
- Use routing rules to reduce alert fatigue across teams and time zones
- Link alerts to escalation workflows in ITSM platforms
- Set predictive alerting based on usage trend analysis and usage forecasts
- Apply policy-based actions on mission-critical systems
A high-fidelity alerting setup protects both uptime and user experience.
Ensuring Secure Access and Role-Based Control (RBAC)
Secure Access means that dashboards will be able to deliver useful information without any associated risks, making use of Role-Based Access Control (RBAC), Single Sign-On (SSO), and data Encryption methods for sensitive data.
- Implement RBAC, SAML authentication, and single sign-on
- Audit user authentication across Entra ID, AWS IAM Identity Center, and Google Cloud IAM
- Isolate dashboards with sensitive data using conditional access and least-privilege policies
- Track sign-in traffic patterns for compliance anomaly detection
- Encrypt data in transit for dashboards across all cloud services
Secure access ensures operational insights never become an attack vector.
Continuous Optimization and Evolution of Dashboards
As cloud environments grow and business priorities shift, dashboards need continuous refinement to remain relevant. By updating KPIs, integrating new services, and expanding telemetry, teams ensure dashboards continue to provide actionable insights and support effective decision-making.
Optimization Area
Action / Example
KPIs
Refresh KPIs based on new business outcomes and reliability targets
New Cloud Services
Integrate newly onboarded cloud services, workloads, and regions
Telemetry Expansion
Leverage cloud application development services to expand telemetry
Operational Efficiency
Monitor efficiency of cloud consulting companies supporting operations
Technology Upgrades
Track firmware version updates, switch provisioning, and infrastructure changes
Continuous Optimization and Evolution of Dashboards
Troubleshooting Common Post-Migration Dashboard Issues
Even mature dashboards require regular tuning to maintain accuracy, completeness, and actionable insights. Common issues include delayed metrics caused by IAM permission gaps, missing logs due to overlooked agent deployments, inaccurate visualizations from inconsistent time zones, broken topology maps resulting from misconfigured networks or dependency mapping, and alert noise caused by misaligned thresholds. Proactive troubleshooting of these challenges restores confidence and ensures sustained observability.
Conclusion: Enabling Cloud Success Through Strong Observability
Cloud monitoring dashboards unlock the true value of cloud migration by providing visibility, security, and performance intelligence. Post-migration monitoring becomes the backbone of cloud transformation-ensuring that every workload continues to deliver a resilient user experience, compliance, and scalability.
BuildNexTech helps companies implement end-to-end cloud monitoring services with expert support across AWS, Azure, Google Cloud, hybrid networking, and application ecosystems. With the right dashboards, organizations transition from migration success to cloud operational excellence.
People Also Ask

What’s the easiest way to decide between a single unified monitoring platform vs multiple cloud-provider dashboards?
If workloads span multiple clouds, a unified platform reduces complexity; if most workloads stay on one provider, cloud-native dashboards are usually sufficient and more cost-effective.
Can I use different Node.js versions for different projects with NVM?
Yes, NVM allows each project to run on its own Node.js version. You can switch versions instantly without affecting other environments.
What factors influence the monthly cost of maintaining cloud monitoring dashboards across clouds?
Costs depend on data ingestion volume, storage retention duration, alerting frequency, licensing of monitoring tools, and analytics processing usage.
Can automation or AI be used to automatically fine-tune dashboard thresholds and alerts after migration?
Yes - anomaly detection and trend-based alerting can auto-adjust thresholds to reduce alert noise and improve early failure detection.
Which roles or team skills are essential for long-term ownership and optimization of cloud monitoring dashboards?
DevOps, SRE, cloud engineers, security analysts, and FinOps teams collectively ensure performance, security, and cost optimization over time.


.webp)
.webp)
.webp)